Paychecks, Bills, and... 'Zines? Exploring Financial Literacy and Systemic Poverty with Eighth Graders
By Antonia Moore
"Poverty is a vicious cycle. Someone takes out a loan to pay off taxes, then struggles to pay off the interest rates on that loan and has to take out another until the bank rejects them due to their credit score. They're left with nothing while the government and the richest of the rich sit and prosper."
"With this perspective, I'll help to end the persecution of those that are pushed below the poverty line."
"I need to give a voice to the voiceless."
"In order to make change, the rich have the most power...it is harder than ever to get out of poverty and more expensive than ever to be in it."
"In order to make a change, the person with the most power is you."
"This unit allowed us to experience real-life things without real-life consequences, such as budgeting for groceries, dealing with debt, or even applying for a loan."
Comments made by seasoned financial professionals? No! Eighth grade students, who, a month prior, were asking, "Why do we have to learn this in school?" and "When are we ever going to use this in real life?"
While the existence of flat-Earthers and anti-vaccinators should be evidence enough, I took to heart the question that so often plagues educators -- Is there a way to weave together a simulation of real-life issues with applicable financial literacy? With that mindset, a cross-curricular financial literacy unit was born. While the core of my ambition in designing such a project was to give students of any privilege a taste of injustice that could serve as a motivator to take action, the essential components of its design was for students to feel real, tangible inequity. They would live as two different people in our classroom -- design a budget, receive paychecks for their profiles, modify their budgets, have financial hardships, apply for loans, and have an opportunity to vote to raise the minimum wage (all with unforeseen restrictions).
This was my fourth year of teaching eighth grade English Language Arts (ELA) in the school district that I attended and in which I was raised. In my K-12 years as a White, middle-class female student, I didn't think much about the district's dynamics regarding socioeconomic status, race, or diversity. Now, as someone paying more attention to the American Indian mascot nicknamed "The Brownie" (and a 0% American Indian population), the 82.5% White population, as well the 30.1% students in economically disadvantaged families, I noticed the disparity of poverty and privilege playing against itself. The diversity and socioeconomic status of the community has changed significantly since I was a student, but the lens to recognize this shift is still foggy. To still hear suggestions in the district that to succeed one simply needs to pull oneself up by their bootstraps is as outdated as a sundial or a quill pen.
I invited a math teacher to join me in this project because of his background and life experience regarding poverty and financial literacy. Mr. Walas, like me, started his teaching career in the urban school he used to attend. His degrees were in finance and economics, and he had worked in the corporate world for about eight years. Before he became a teacher, he traveled the world, including every state in the U.S. and nearly every continent, realizing how much young people thirst for knowledge, and how math could empower people. Mr. Walas' background was a great fit for the project I was designing.
I started to research how to accommodate marginalized students in a privileged school setting. To create the biggest possible change in systemic socioeconomic oppression and disrupt the narrative by which it is perpetuated, I came to believe the population to address was not students who experience oppression, but those with greater social and economic status. Giving tools to those that most need them seems second-nature, but strategies like a canned food drive for the hungry, for example, are short-term solutions for perpetual cycles of poverty.
I designed a project that immersed students in an authentic multi-faceted experience, with profiles I generated based on real people. Just a few examples of the twenty profiles include a grandmother living on an American Indian reservation, someone diagnosed with OCD, a single parent, a gay couple who loses their house in a natural disaster, and a new teacher trying to afford student loans, rent, and classroom supplies (the imagination did not have to be stretched far on that one).
I knew colleagues who would be eager to do this project with me, and the principal was supportive. He stopped in periodically during the project, which made students feel like they were doing important work. All of the nearly 90 students share the same teachers across disciplines, so we were able to bring students together each class period to work on this project.
The Financial Literacy Project
To get students thinking about their own biases regarding poverty before and after the project I used Plickers (a free, anonymous-to-other-students data collecting app that only requires a device by the teacher) to answer True, False, or Unsure to the following statements:
- All people have equal potential to succeed.
- When someone isn't making enough to get by, it's usually because they're lazy.
- Helping people that are struggling will keep them from being able to help themselves.
- If someone isn't doing well somewhere, they should move.
- As long as people work hard enough, they can have what they need to live comfortably.
We revisited these statements at the conclusion of the project, and it was important that the students consider their biases before starting the financial literacy unit and the poverty vs. affluence simulation. I collected data across five classrooms of students at the onset of the project. Students' responses are represented as percentages in Figures 1 – 5.

Figure 1: Pre-Data: All people have equal potential to succeed.

Figure 2: Pre-Data: When someone isn’t making enough to get by, it’s usually because they’re lazy.

Figure 3: Pre-Data: Helping people that are struggling will keep them from being able to help themselves.

Figure 4: Pre-Data: If someone isn’t doing well somewhere, they should move.

Figure 5: Pre-Data: As long as people work hard enough, they can have what they need to live comfortably.
The "Secret" Day One
The plan was to generate spirited inquiry based on a reflex sparked by injustice. I wanted students to have a visceral reaction to the discrepancy in their access to resources as a hook.

Figure 6: The fictional Time Magazine cover template.
The day before we kicked things off, I told students Time Magazine was writing a piece about how people stop coloring with crayons after elementary school. The editors were holding a coloring contest for a template they provided (see Figure 6). I told students if they won, they could receive $500, their colored template would be the cover of Time, and they would have their picture in the magazine. Students were excited, until I told them an arbitrary number would determine how many crayons they could use. I would choose the colors, and they could not share them. One student received 15 crayons. One was given 10 crayons. Some were given 3 or 4, many got 1 or 1/2 a crayon. One student in each class period received a white crayon with which to color the template printed on white paper. The outrage was palpable; they needed this taste of inequity to fuel the work ahead.
These are just some of the "colorful" comments the students made as they tried to finish their cover:
- "There's a problem with this system!"
- Student with five crayons: "I can't do a good job!"
- Student with a single white crayon: "You're complaining?!"
- Student with fifteen crayons: "These are bad colors. I’m only going to use two of them."
- Student with ½ crayon: "Stop complaining! I wish I had three kinds of green!"
- "I'm not coloring this good because I can't. I'm not going to win."
At the end of the period, I told them time was up, collected the templates, and said nothing more.
Day One -- As Far as the Students Knew!
This project took place in the school library twice each day, once for Math and once for English. Each period on day one, students came into the library and found their assigned table. There, a colorful folder awaited them. Unbeknownst to students, green folders contained profiles with a high socioeconomic status (SES), yellow folders were middle-class SES, and red were low SES profiles. Each student had two different colors between the two periods, for comparison purposes.
First, they read their profile information and used the guiding worksheet to make a tentative budget for the expenses contained in their profiles. They used a Chromebook to reflect and journal using Google Keep, answering the question, "Summarize your person's profile in a few sentences. What did you budget for today?" Since students would have two responses by the end of the day, one per profile, they were encouraged to color-code their responses for clarity.

Figure 7: Students Using Supermarket Fliers
Day Two -- Budgeting for Groceries
Students were given a worksheet to calculate a grocery budget. They had to decide the quantity and type of food they would need for a week's worth of groceries, determine prices, then multiply to create a monthly budget (see Figure 7). Students were reminded they could not live off of peanut butter and ramen noodles alone, and that they should consider toiletries as well. One bold but embarrassed young man approached me to ask if he should include feminine sanitary products since his profile was a woman. When I encouraged him to do so, he returned to me again, baffled at how expensive these items are.
Once they developed a grocery budget, students received their profile's bi-monthly paycheck. They edited their budget to align with their profile's resources. Once they modified the best they could (and took many groceries off some of their lists), students journaled their answer to the question, "How did your budget change for your profile after you received your paycheck?"
Day Three -- Applying for a Loan
Each profile was assigned a financial hardship (such as a car breaking down or needing a medical procedure), the amount it would cost, and a credit score. Students were told they could apply for a loan if they needed help paying for the financial hardship.
Before students did specific work with calculating their loans, they were given a worksheet that defined terms of principal amount, loan term, APR %, and FICO score, and broke down how to use the numbers in a step-by-step process that students could follow. They had some experience in using spreadsheets and calculating how to turn percentages into decimals before this activity, so this part built on and connected to prior knowledge.
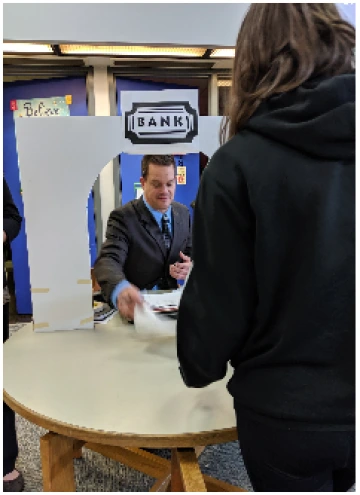
Figure 8: Student Bringing Her Credit Score to the Bank to Get Her APR% from Mr. Walas.
Students applied for a loan at a bank run by Mr. Walas who was acting as a loan officer. They reported their credit score to Mr. Walas (see Figure 8). Based on their credit score, Mr. Walas gave them a specific 5- and 10-year APR percentage.
With APR percentages in hand, students returned to their tables to determine, with their group, which loan their profile could afford using the formula loan = principal amount x rate x time. Students calculated how much they would pay back for the loan overall, and tried to fit the payments into their budget. Finally, students used Google Keep to journal their response to the prompt, "In your own words, describe: Principal Amount, APR%, and Loan Term. What did you learn about calculating interest on a loan?" Ultimately, many students realized that their profiles would have an easier time paying the 10-year monthly payment, but that would also cost them hundreds or thousands more dollars in the long-run.
Final Day in the Library
Students filed into the library, intrigued, yet carrying the stress of their virtual financial burdens. Some students commented that they were afraid to open their folders today, that being an adult was way harder than they thought, and that if they had another financial hardship today, their profile wouldn't be able to afford to eat.
Students were told, with great enthusiasm, that there was a question of raising the minimum wage in their district! In their folder, they would find Voter Information tailored to their profile, explaining whether their profile made more or less than minimum wage, and how a yes vote would impact them financially. For many who made less than minimum wage, they would be able to modify their budget to afford more necessities, but the higher-SES profiles who held political positions might have disadvantages because a yes vote might make many potential voters for their campaign unhappy with them. Students were encouraged to vote according to how their profile would vote.
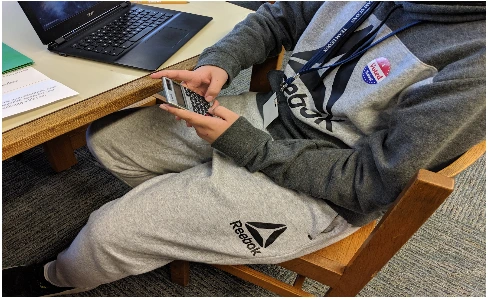
Figure 9: A Student Whose Profile Got to Vote Proudly Wears His Sticker.
First, a survey vote was taken. Each group cast a ballot. The average tended to have results of about five profiles voting no to raise the wage, and 15 profiles voting yes. Before the official vote was cast, students calculated the percentages of those results. Students then opened an official ballot envelope in their folder. Some had ballots in the envelope, but many (usually the yellow middle-SES and red low-SES folders) found a note telling them they could not vote that day. One profile couldn't vote because they had a felony charge, another was undocumented, another lived on an American Indian reservation and her address wasn't officially recognized. Students who could vote presented their ballots and received an I Voted sticker, much to the chagrin of non-voters (see Figure 9).
When final ballots were counted, the results changed dramatically, sometimes even tipping in favor of not raising the wage. While the original vote tended to be about 5 no and 15 yes votes, the results for the official vote, with the restrictions, tended to be about 5 no and 4-6 yes votes. Many of the profiles who would have voted yes to improve their lives and financial standing had a higher likelihood that they had a restriction in voting in the first place.
Many students whose profiles would have benefited from increasing the minimum wage were exasperated that their profile was not permitted to vote. They shook their heads at the profiles that voted no, especially when students shared the reason their profile voted no was because they would only be able to afford one personal assistant instead of two, or it might affect their run for office.
Students calculated the percentages for the sparse voter turnout and used the remainder of the period to give side-eye looks to the stickered voters, while answering their final question on Google Keep: "Compare the two profiles you lived this past week. Summarize! Be specific about some numbers and reflect about the voting results."
What Did Students Do with This Experience and Information?
In class the following day, before moving on to the next phase, I admitted to students that the Time Magazine contest was a ruse (followed by a chorus of I knew it! and Come ON!). I hung up five contest submissions—one, colored with white crayon, looked blank; one aggressively scribbled with only a blue crayon; one that looked colorful and immaculate; one that had two clashing colors; and one that only had one color, but lots of interesting patterns—and invited students to examine them. "If you were to make an assumption as someone that didn't know about the 'limited crayons' rule, which one seems like the person cared the most? The least?" This started a discussion about social inequities. I explained that the financial literacy unit gave them a first-hand look at what it means to have different opportunities. With this experiential orientation to wealth disparity, they were ready for the next step.
What Do You Mean, What's a "'Zine"?
The cumulative project for the financial literacy unit was to complete a research project on a topic related to poverty of their choosing, and contribute to a collaborative classroom 'zine. A 'zine is a self-published, non-commercial, often handmade publication that can be about any topic. 'Zines can be found everywhere, especially in political or punk scenes, and are usually produced on a photocopier, though they are found online as well. Historically, the easy-to-make and unique format helped spread and share the voices that were not always heard. To reflect each students' individual voice, they could work within semi-strict guidelines for research, but have the freedom to make the format of their pages all their own.
Students researched their topics individually. Some students who chose the same topic collaborated in the sense of determining who might tackle the same element of that topic so there wasn't redundancy, but all students took ownership of their own 'zine pages. The goal for each student was to contribute their two pages for the class period's 'zine, resulting in five 'zines all together.
Students had the freedom for how they presented the information on their topic. One of the best qualities of 'zines is the unstructured presentation of information: students can type, handwrite, doodle, include photographs, present an argument, infographic, narrative, or on-paper speech. Students knew that if the root of their call to write was to inform, that a writer is obligated to present both sides of an argument, and that since their call to write was also to persuade, they might persuade the reader to take action.
After examining some real-life 'zines to generate ideas, students had the freedom to format the pages on their own. One of the best qualities of 'zines is the no rules presentation of information: students are afforded immense creative freedom.
Some of the topics that students researched were:
- free breakfast and lunch for all students
- raising minimum wage
- early childhood literacy
- loss of voting rights due to a felony charge
- homelessness in teens
- universal health care
- loan/credit policies
- the cognitive effects of poverty regarding education and nutrition
- affordable housing
- social/emotional skills
- what happens to pets during a financial crisis
- access to mental health resources for people living in poverty
- food stamps
- foster care
- money management
- the widening poverty gap
When students considered a research topic that interested them (and was usually a topic that one or both of their profiles had grappled with), they told me what they wished to research in order to prevent overlap and to connect students in collaboration. I kept a master document of each class's research topics, and also provided a list students could choose from (drawn from the experiences of the profiles) if they were unsure which topic to pursue.

Figure 10: Antonia Moore, Displaying Zines in the Front Lobby of the Library.
After weeks of research, editing, feedback, and sending the originals to a local print shop, the 'zines were displayed at the local public library and online (see Figure 10). Each student received a copy. Readers who would like to see the PDFs of student work for the two years of the project can find them on the public Google Classroom using the code 6xnxux2.
Data, Data, Data!
One day as they engaged in research for their 'zines, I had students take a break in order to revisit the statements they considered prior to the start of this financial literacy unit. They used Plickers to again reconsider the same statements from before.
Since so many students were absent on the day I was collecting the post data (due to a field trip and time constraints), the results may look a lot different than if all of the students had been able to participate. I was able to look at individual students' responses on the Plickers data dashboard to see which students changed their thinking, stayed their original course, or were able to determine a true/false instead of an unsure response (see Figures 11 – 15). Most of the data I collected was informal, through conversations with individuals as they worked their way through the unit and their research. I posed the questions on Plickers for self-reflection more than for concrete data collection.

Figure 11: Post-Data: All people have equal potential to succeed.

Figure 12: Post-Data: When someone isn’t making enough to get by, it’s usually because they’re lazy.

Figure 13: Post-Data: Helping people that are struggling will keep them from being able to help themselves.

Figure 14: Post-Data: If someone isn’t doing well somewhere, they should move.

Figure 15: Post-Data: As long as people work hard enough, they can have what they need to live comfortably.
Many students who responded Unsure to some of the pre-data felt they could answer True or False with more certainty at the time of the post-data. Some reported changing their thinking about an initial answer once they experienced their profiles' hardships. While the pre- and post-data collected was valuable to encourage students to consider initial biases and how those biases changed over the course of the project, the informal, anecdotal data was even richer.

Figure 16: Guidelines and Principles for Students’ Individual Reflection Video.
The Final Portion of the Project: Reflection Videos
As a final reflection, students recorded a short video on Padlet answering the question, "When it comes to making the biggest change, who has the most power?" (see Figure 16).
Students drew upon everything they had researched, identifying their blind spots, touched on problems and action plans associated with a topic they were passionate about, and spoke with newfound compassion, conviction, and maturity. People can say what they will about eighth graders, but they are truly some of the most incredible people. The world is in good hands. With the openness and boldness with which they operated in this project, their natural curiosity also served as motivation to do important work, and share their thoughts.
Here are some of the reflections made in their videos:
- "Each and every one of us has the power to make change."
- "I now know that not everyone gets the same chances. In order to make a change, those who do not need the minimum wage can vote to increase it for the bottom quarter of the workforce that needs it."
- "I didn't realize how expensive it was to live in poverty."
- "In order to make the biggest change, I have to give a voice to the voiceless, because my voice can help them be heard."
- "If an or a convicted felon wanted to vote about something that could impact them, they would have to rely on someone with more social power to vote because they couldn't."
- "I think the people who have the most power are the people that don't need the change to happen."
- "I think those who have the most power to make a change are us kids, but people don't take kids seriously."
- "I think the best thing people can take away from a project like this is to be aware of the people around you."
The best thing about this project was having an opportunity to work with the Math teacher to foster a community of spirited inquiry, collaboration, and empathetic reasoning that had real-life application and value. There are so many ways English and Math teachers can collaborate, and that isn't always possible with the expectations of standardized testing preparation.
While it was still unclear what the school year would bring due to the COVID-19 crisis, many of the social issues that this unit brought to light were illuminated as the pandemic took shape. Approaching the next iteration of this unit with sensitivity to grief and trauma, I plan to perhaps modify or adapt some case studies to highlight more modern social issues that were seen or felt by some students as COVID-19 affected their lives.
One of the best ways to make this project even more authentic moving forward is to apply a variety of voices to shape a bigger worldview for my students. Included below is a list of literature I have considered incorporating concurrently with this project
Chapter Books:
The Benefits of Being an Octopus by Ann Braden
Fish in a Tree by Lynda Mullaly Hunt
New Kid by Jerry Craft
Free Lunch by Rex Ogle
Eleanor and Park by Rainbow Rowell
Money Hungry by Sharon G. Flake
Rural Voices: 15 Authors Challenge Assumptions About Small-Town America by Nora S. Carpenter
Picture Books:
The Last Stop on Market Street by Matt de la Peña
Shelter by Céline Claire
Those Shoes by Maribeth Boelts
A Bike Like Sergio's by Maribeth Boelts
A Chair for My Mother by Vera Williams
Maddie's Fridge by Lois Brandt
A Place to Stay by Erin Gunti
Through this financial literacy project, I realized that by drawing students into the liminal space outside of their comfort zones, instead of giving up, they rose to the challenge, because they had a personal this-could-be-my-future investment in the skills they grappled with. It wasn't an easy project to design, but things worth doing tend to be the most complex. As the world and its circumstances change, this project will change with it.
What I loved most was having conversations with students about their writing, giving them a chance to put their authentic selves on the page, and have a positive, motivated experience in reading and writing. Students enjoyed having opportunities to learn about the world. They realized they didn't need to be given a voice because they had one all along; they just needed a reason to use it.
Children's Literature References
Boelts, M. (2016). Those shoes. Candlewick.
Boelts, M. (2016). A bike like Sergio's. Candlewick.
Brandt, L. (2014). Maddi's fridge. Flashlight Press.
Brayden, A. (2018). The benefits of being an octopus. Sky Pony Press.
Carpenter, N. S. (2020). Rural voices: 15 authors challenge assumptions about small-town America. Candlewick.
Claire, C. (2017). Shelter. Kids Can Press.
Craft, J. (2019). New kid. Quill Tree.
de la Peña, M. (2015). The last stop on Market Street. Penguin.
Flake, S. G. (2009). Money hungry. Little, Brown.
Gunti, E. (2019). A place to stay: A shelter story. Barefoot Books.
Hunt, L. M. (2015). Fish in a tree. Penguin.
Ogle, R. (2019). Free lunch. Norton Young Readers.
Rowell, R. (2013). Eleanor and Park. St. Martin.
Williams, V. B. (1982). A chair for my mother. HarperCollins.
Antonia Moore teaches eighth grade English Language Arts at Agawam Junior High School in Feeding Hills, Massachusetts. (ORCID https://orcid.org/0000-0002-2018-1086)
© 2021 by Antonia Moore
WOW Stories, Volume IX, Issue 1 by Worlds of Words is licensed under a Creative Commons Attribution-NonCommercial-ShareAlike 4.0 International License. Based on a work by Antonia Moore at https://wowlit.org/on-line-publications/stories/volume-ix-issue-1/5.
WOW stories: connections from the classroom
ISSN 2577-0551


