Exploring Flow Charts as a Tool for Thinking
by Jaquetta Alexander & Jennifer Griffith, First/Second Grade Teachers, Van Horne Elementary School
We consider ourselves fortunate to teach at a small urban elementary school because our staff of eight teachers allows for a high degree of collaboration. Our school year begins with a retreat in which we work together to establish a school-wide concept that every grade level uses as a framework for the school year. We decided on “power” as our concept because of the relevancy to our curriculum and student interest in issues of power the previous year. Within that framework we strive to challenge student thinking and find meaningful ways for them to respond to literature to deepen their understandings.
In our teacher study group, we discussed our observation that first and second graders could identify the beginnings and end points of story plots and character actions, but sometimes missed the events in between that influenced those plots and actions. We identified the need to enable students to see sequences and the relationships between cause and effect. Moline (1995) argues that flow diagrams are useful to show change, growth/development, and cause and effect. Once we made the connection between our desired outcome and Moline’s work, we began using flowcharts with students.
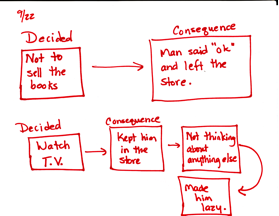
Our Learning Lab teacher, Lisa Thomas, introduced the students to flowcharts after reading The Pink Refrigerator by Tim Egan (2007). During this lab session we focused on the power of consequences. Bailey portrays her understandings by stating, “I noticed that he made the choice to do what was on the refrigerator, but then he didn’t know what to do when the last note was there so he learned to do things by himself.” When the students were asked to think about everything that happened in the book, Lisa depicted their thinking in a simple flowchart that reflected Dodsworth’s decisions and the consequences that resulted. The simple diagram shows how one idea connects to another and creates a chain reaction. This diagram allowed the students to explore cause and effect by stating the decision and the consequence.
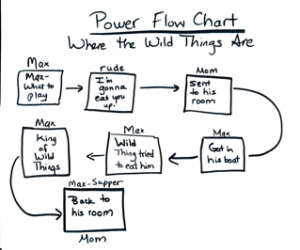
In our next lab session Lisa read The Wild Things by Maurice Sendak (1963) and we focused on the power we have over other people and the power they have over us. The impact of our previous discussion about decisions and consequences was apparent in the literature discussion. Morgan stated, “They are mad and for a consequence they showed their teeth.” Carah said, “Max had power over the monsters –- he told the wild things what to do.” The class created a flowchart together depicting the elements of power in the story. The students easily identified the shifts in who had power at this point, which are represented in the writing above the cells in the flowchart.
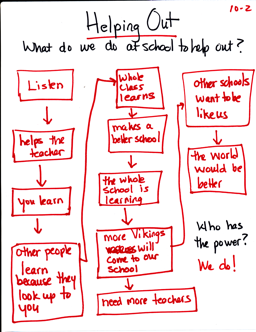
The Learning Lab is often a catalyst for our teaching in the classroom. With their knowledge of flowcharts and seeing where the kids were at with their understandings of power, we knew it was time to move our thinking into our classroom. Knowing that kids like to look for beginnings and endpoints, we chose to use a simple version of a flowchart that allowed kids to chronicle the important events from a book. This type of visual organizer allows kids to think about the sequencing of a story and focus on the causes and effects of decisions made by the characters. We used stories from our reading series, both fiction and non-fiction. With second grade we read the story Helping Out by George Ancona (1985), a photo essay about young children helping out adults at home, at school, and in the community, and the rewards of helpfulness. We created a class flowchart on ‘what do we do at school to help out.’ The kids were able to take their thinking about flowcharts from the learning lab and our discussions to create a flowchart about how they help out at school. Moline (1995) states that the use of flow diagrams allows kids to organize information in meaningful sequences. Because we were focused on cause and effect relationships, their simple idea of “We help out by listening” grew to be as complex as, “We could help out by making the world better if other schools were like ours.”
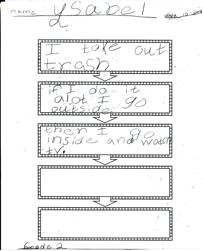
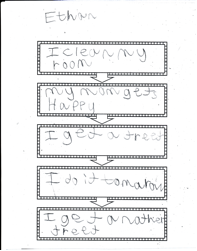
It was obvious that using the response strategy of flowcharts was starting to make sense and deepen their understanding. We felt that we were providing them with a tool for their thinking. With each new discussion, we were constantly connecting to our concept of power. When asked who had the power to help out our school their response was, “We do!” It was exciting for us to see their thinking begin to evolve, however, the flowcharts that we asked the students to create independently were not as successful. After we completed the class flowchart of helping out we asked the students to complete a flowchart showing cause and effect by selecting a chore that is completed at home. They were asked to show the consequences of their helpfulness. These flowcharts were evidence that they were on the edge of grasping the strategy, but still needed guidance and practice.
After using simple forms of visual organizers with various stories from our reading series, we knew we needed to challenge their thinking in regards to responding using this tool. As the winter holidays approached we struggled with an inquiry to undertake that would support our work in the Learning Lab with our concept of power and use of flowcharts. We value inquiry as a stance on the significance of how we learn, not only because this stance influences student learning of content, but also because it influences who learners become as human beings (Short, 2009). Our collaborative efforts with our students led them to decide on a country inquiry about Greece and India. We delved into understanding the holiday traditions of each of these countries through guest speakers, read alouds, songs and non-fiction texts.
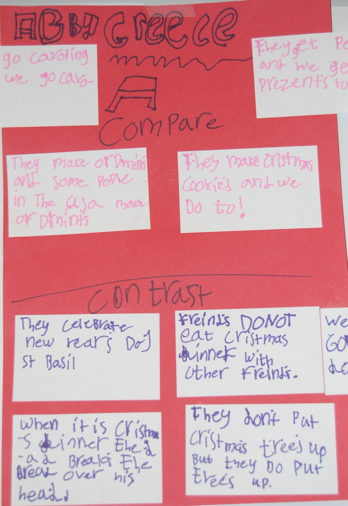
We referred back to Moline (1995) to review the types of visual organizers for an idea of where we wanted to head with flowcharts and organizers. We knew the kids were learning about the similarities and differences between the Greek and Indian cultures so finding an organizer that supported that thinking was challenging. We wanted kids to develop the recognition that other cultures are similar and different to their own and have a respect for others’ stories. We also wanted children to have choice in their learning and offered them two varieties of organizers. One was an organizer to compare and contrast a country’s holiday traditions to their own traditions. Flowcharts tend to illustrate a flow or sequence of a story and in this case, kids needed to think about comparing and contrasting and so using a comparison organizer seemed the perfect tool to support their thinking. After searching for the right one we decided to create our own version of a comparison chart, one that helped organize their thoughts in a way they were familiar with after working with flowcharts. The result was for them to split their paper in two with the labels of compare and contrast and on note cards write their comparisons and contrasts of the country they chose. The note cards limited their space and forced them to write concise statements similar to the boxes they had grown used to in the flowcharts we had worked with over the last months. We were impressed that kids took their time and wrote insightful similarities and differences. Introducing the comparison chart was a great tool for supporting their understanding of comparisons and contrasts. Abby chose to create a visual organizer of comparisons for Greece.
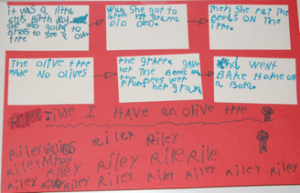
The second type of organizer we offered as a choice was a familiar type of flowchart — a linear chart that sequenced the significant events in a story. To support our inquiry study of Greece and India we read international literature that gave the kids a glimpse of life in those countries as well as non-fiction texts. Kids who were drawn to a particular story had the option of chronicling the events from the story into a linear flowchart. Linear charts help kids organize their thinking in a sequential manner, allowing them to go from the beginning to the end of a story. Often, young children need a tool that supports this thinking, allowing them to visually see the whole story. Riley chose to create a linear flowchart on a story from Greece, I Have an Olive Tree by Eve Bunting (1999). She carefully chose the important events to chronicle on her flowchart. Once again, the use of note cards limited the kids’ space so they had to select their words carefully, a skill that can be challenging for young kids.
Kids need to have freedom when choosing their tools for responding so that they have ownership and take pride in their work. All the students took their time and really thought about what they were writing. When kids chose to create a flowchart in response to a read aloud, they thought about the significant events and chronicled them in their own words. It was at this moment that we saw how powerful flowcharts were in providing kids with an organizational tool for their thinking about a book. Instead of merely summarizing what happened, they were supported in focusing on the relationships of cause and effect and sequencing. In their early experiences with flowcharts, a lot of our time was focused on the procedure of how to create the chart and kids’ questions of what to do. Their work with these charts indicated that our students had officially moved from focusing on the procedure of flowcharts to becoming fluent with their understanding of them. They could now use them as a tool for understanding.
After winter break we decided to continue with flowcharts. We knew from experience and research that kids learn best when they are able to focus on the same response strategy over time so they really come to understand the potentials of that strategy and can use it flexibly as a tool. Our work with flowcharts was having an impact on their thinking and their ability to organize ideas, events, and processes in the literature and inquiries we were exploring. The more we offer them the opportunity to work with a particular type of response strategy, the more fluent and flexible they become in using this strategy. Our goal was for kids to acquire enough experiences with visual organizers to use them independently by the end of the school year.
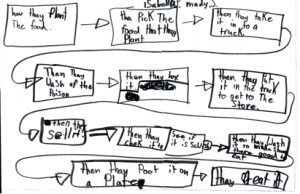
After the fall our school-wide concept shifted to thinking about the power of food for the spring semester and our kids became excited about gardening and the life cycle of plants. The classroom became inundated with texts and posters illustrating the life cycle of plants and the importance of gardening. We had a guest speaker teach us about the proper way to garden in the desert; the kids were engaged and eager to plant their vegetables. Upon doing this we decided that we needed to bring in flowcharts that would help them illustrate their learning. In the Learning Lab the kids had been studying the process food goes through to get from the farm to the table, using charts that were similar to the ones we had been exploring in class — simple flow diagrams that illustrated the process of how food gets to your table. Although these flowcharts were effective in supporting sequencing, we knew it was time to introduce more complex organizers to build their repertoire of different types of flowcharts.
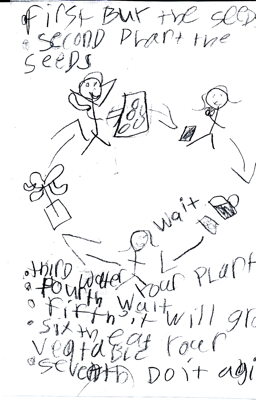
It seemed natural then that we push out kids to expand their use of flowcharts within our study of the cycle of plants. We referred back to Steve Moline (1995) where he talks about cyclical flow diagrams and how they are best used in describing continuous processes such as cycles. This was a flowchart we hadn’t experimented with yet and it seemed to fit perfectly into our inquiry of gardening. We challenged our students to think about what we had been learning about the planting process and how they could represent that in a flowchart. After engaging in a conversation, we decided to create a flowchart of our learning as a class. The process helped the kids see the cycle visually and they seemed to grasp the concept quickly.
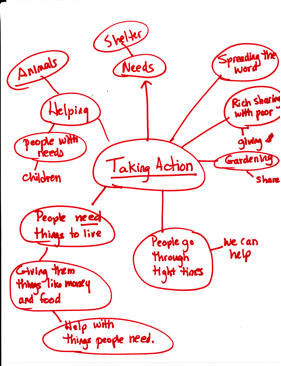
Our understandings about gardening enhanced our conceptual understanding of the power of food. It was that time in the school year to take action based on our learning. Our Learning Lab experiences were filled with stretching our thinking about the concept of taking action. We had finally moved into more complex flowcharts according to Moline (1995). We decided to use concept webs, a tool used to make connections between concepts, when discussing the meaning of taking action. In the Learning Lab Lisa had the kids stretch their thinking out of their comfort zone of cyclical and linear flowcharts to creating a concept web on taking action. This type of web encourage them to think about what taking action is, what it looks like and what it means to them. Their ideas are surrounded by the center concept of taking action. Webs were not something new to our students, but using them in the context of flowcharts as a concept web was new. The kids were able to come up with several ideas that fit into the web.
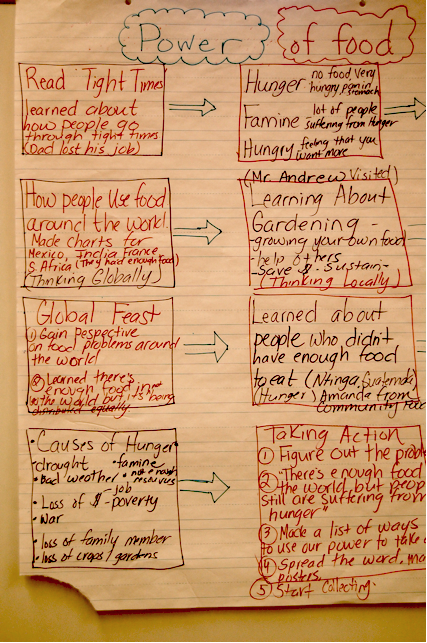
Our exploration of power had taken us on quite a journey; a journey we knew needed to be recapped in order for our taking action piece to be meaningful. It was important to us as teachers for our kids to revisit our process of taking action related to the power of food. We were hoping to integrate a visual organizer into our discussion but knew that the kids needed to lead and that we should not set it up for them. We came together as a class, asking them to think about what they learned about the power of food. It was natural for them to start with the story Tight Times (Hazen, 1983), that had been read in lab to begin our thinking about the power of food. Once they decided to start with this story, the class decided to create a flowchart of our learning for the semester. We were excited to see our kids naturally drawn to creating a linear flowchart, a sequencing of our significant moments in learning about the power of food.
After reflecting on the different flowcharts that we had created across the year, it was exciting to see the evolution of the kids’ thinking and understanding related to this response strategy. Flowcharts is a strategy that allowed our kids to see the whole picture when reflecting on a piece of literature, concept, or process. Their evolution began with a simple format where they summarized a story or event in chronological order, moved to writing their thinking in concise statements and comparing and contrasting, and finally creating cyclical diagrams and concept webs. The one area where we wished we had spent more time was in having kids independently create flowcharts so that this strategy became a natural part of what they did on their own as inquirers to make sense of ideas.
We saw two main areas of learning for our students. One was the use of flow charts and other visual organizers as a tool for thinking about relationships, such as sequencing and cause and effect. These visual organizers provided them with a way to sort out and show how ideas or events relate to each other in some kind of order or chronology. The second was that they identified conceptual patterns to look for in other engagements and texts. They were beginning to understand, for example, that cause and effect and the way that decisions lead to consequences is a pattern they can look for as they read or engage in activities in order to make sense of those experiences.
Often, students are introduced to a response strategy and then quickly moved to another one without having the opportunity to really explore that strategy in meaningful ways and in enough depth that they develop flexible understandings of its potentials. We have learned as educators that children need time to explore and become fluent with a response strategy. Otherwise, their focus remains on the procedures of how to do the strategy, rather than on using the strategy as a tool for thinking. Our goal is for students to view our classroom as a place for thinking and for life work, not just for completing tasks and school work.
References
Ancona, G. (1985). Helping out. New York: Clarion.
Egan, T. (2007). The pink refrigerator. Boston: Houghton Mifflin.
Hazen, B. (1983). Tight times. Ill. by T. S. Hyman. New York: Puffin.
Moline, S. (1995). I see what you mean: Children at work with visual information. York, ME: Stenhouse.
Sendak, M. (1963). Where the wild things are. New York: Harper & Row.
Short, K. (2009). Inquiry as a Stance on Curriculum. In International Perspectives on Inquiry Learning. S. Carber & S. Davidson, eds., London: John Catt Pub.
WOW Stories, Volume I, Issue 3 by Worlds of Words is licensed under a Creative Commons Attribution-NonCommercial-ShareAlike 4.0 International License.
Based on a work at https://wowlit.org/on-line-publications/stories/storiesi3/.

One thought on “WOW Stories: Connections from the Classroom”
Comments are closed.